K-means Clustering
In this blog, we are going to learn about K means Clustering

Clustering
Clustering is the process of dividing the dataset into groups, or clusters. The objective is to divide the data into clusters where points are very similar to one another and distinct from one another. Clustering algorithms assign (or predict) a number to each data point, indicating which cluster that specific point belongs to, similarly to classification algorithms.
K-Means Clustering
One of the simplest and most popular clustering techniques is k-means clustering. It looks for cluster centres that are typical of particular data regions. Two steps are alternated in the algorithm: Each cluster centre is established as the mean of the given data points after each data point is assigned to the closest cluster centre. When instances are assigned to clusters consistently, the method is complete.
Initially, define a target number K, which refers to the number of centroids you need in the dataset. A centroid is an imaginary or actual location representing the centre of the cluster. The K-means algorithm identifies the K number of centroids, then allocates every data point to the nearest cluster while keeping the centroids as small as possible. To process the learning data, the K-means algorithm in data mining starts with the first group of randomly selected centroids, which are used as the beginning points for every cluster, and then performs iterative (repetitive) calculations to optimize the positions of the centroids. It halts after creating and optimizing clusters when either the centroids have stabilized i.e. there is no change in their values because the clustering has been successful or the defined number of iterations has been achieved.
Algorithmic Steps for K-Means Clustering
Step 1 : Let X = {X1,X2,…,Xn} be the set of data points.
Step 2: Arbitrarily select ‘K’ cluster centres denoted as C1, C2,..., Ck.
Step 3: Calculate the distance between each data point with the cluster centres by using any distance measurers.
Step 4: Assign the data points to the cluster centre whose distance from the cluster the centre is minimum with respect to other cluster centres.
Step 5: Recalculate the distance between each data point and its centres to get new cluster centres using mean.
Step 6: Repeat from step 3 till there is no change in the cluster centre
Methods
Let's discuss the methods used to find the optimal number of k clusters
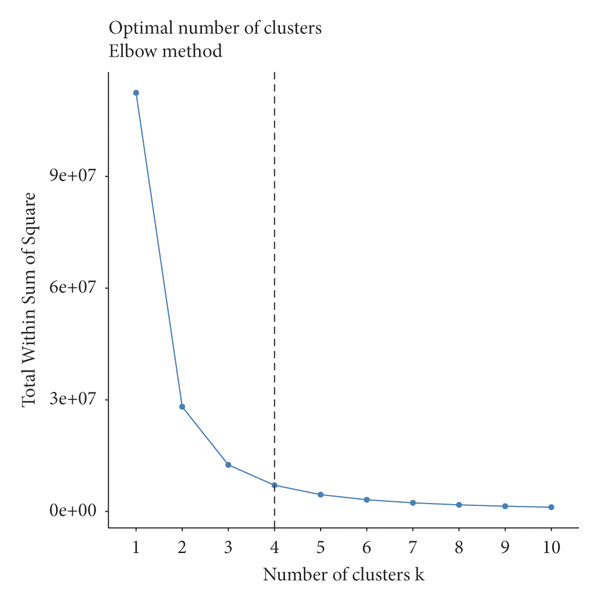
Elbow Method
The Elbow method looks at the total within-cluster sum of squares (WSS) as a function of the number of clusters. One should choose a number of clusters so that adding another cluster doesn’t improve much better the total WSS. The total WSS measures the compactness of the clustering and we want it to be as small as possible. WSS is the sum of squares used to determine the optimal value of K. The formula to find WSS is given as
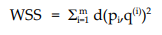
Where pi represents the data point and q(i) represents the cluster centre.
Average Silhouette Method
The Silhouette method is used for the interpretation and validation of consistency within clusters of data. It provides a graphical representation of how well each object has been classified. It measures the quality of a clustering. That is, it determines how well each object lies within its cluster. A high average silhouette width indicates a good clustering. The average silhouette method computes the average silhouette of observations for different values of K. The optimal number of clusters K is the one that maximizes the average silhouette over a range of possible values for K.
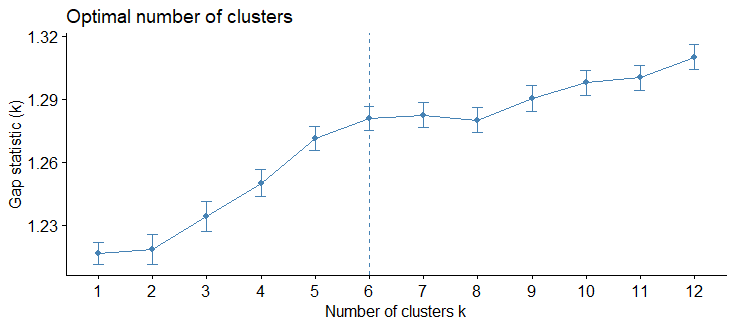
Gap Statistic Method
The gap statistic approach can be applied to any clustering method. The gap statistic compares the total within intra-cluster variation for different values of K with their expected values under the null reference distribution of the data. The estimate of the optimal clusters will be the value that maximizes the gap statistic. This means that the clustering structure is far away from the random uniform distribution of points.
We will learn new things in the upcoming blog, until connect with me and share this blog with your friends and colleagues!....💖.