
Supervised Learning
Let's learn about Supervised Learning in this blog📑.

Supervised Learning
Supervised learning imitates our ability to extract patterns from known examples and use that extracted insight to engineer a repeatable outcome.
When we wish to predict a certain outcome from a given input, we utilise supervised learning, and we have examples of input/output pairings. From our training set of input/output pairings, we create a machine learning model. Our objective is to produce accurate forecasts for previously unseen data. Supervised learning requires human work to create the training set, but it then automates and frequently speeds up an otherwise arduous or infeasible process.
Working
For example, it can be estimated using the labelled examples of other cars recently sold on a used car website. With access to the selling price of other similar cars, the supervised learning model can work backwards to determine the relationship between a car’s value (output) and its characteristics (input). The input features of your car can then be inputted into the model to generate a price prediction.
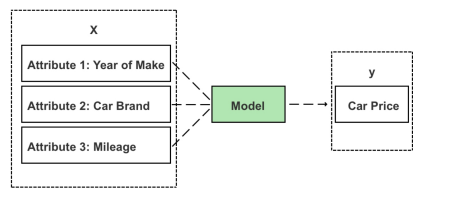
While input data with an unknown output can be fed to the model to push out a prediction, unlabeled data cannot be used to build the model. When building a supervised learning model, each item (i.e. car, product, customer) must have labelled input and output values—known in data science as a “labelled dataset.”
Types
There are two major types of supervised machine learning problems: classification and regression.
Example
House Price Analysis using Supervised Learning
We will use several datasets to illustrate the different algorithms. Some of the datasets will be small and synthetic (meaning made-up), designed to highlight particular aspects of the algorithms.
Use Jupyter Notebook.
import pandas as pd
import numpy as np
from sklearn import linear_model
import matplotlib.pyplot as plt
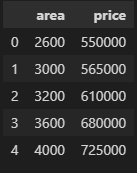
- Datasets of sample.csv are read by using pandas.read_csv. Pandas read the csv data and displayed it while we print the data frame.
df = pd.read_csv('sample.csv')
df
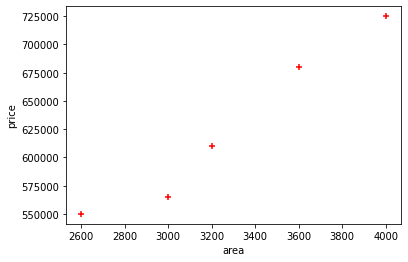
- The following code creates a scatter plot visualizing all of the data points in this dataset. The plot has the first feature on the x-axis and the second feature on the y-axis. As is always the case in scatter plots, each data point is represented as one dot. The colour and shape of the dot indicate its class:
%matplotlib inline
plt.xlabel('area')
plt.ylabel('price')
plt.scatter(df.area,df.price,color='red',marker='+')
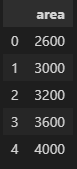
- Drop the column 'price'
new_df = df.drop('price',axis='columns')
new_df
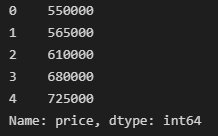
- Set a DataFrame for 'price'
price = df.price
price
reg = linear_model.LinearRegression()
reg.fit(new_df,price)
//LinearRegression()
- Predict a price of area[3300]
reg.predict([[3300]])
//array([628715.75342466])
reg.intercept_
//180616.43835616432
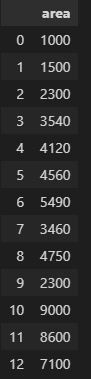
area_df = pd.read_csv("areas.csv")
area_df=pd.DataFrame(area_df,columns=['area','price'])
area_df
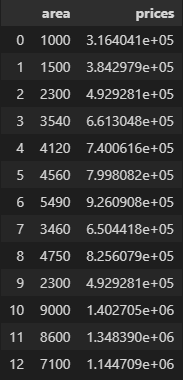
- Drop the NaN column and apply the prediction function to get the price prediction.
value=area_df.dropna(axis=1)
p=reg.predict(value)
area_df['prices']=p
area_df
- Create a file 'prediction.csv' of our program output.
area_df.to_csv("prediction.csv")
Prices of houses will be shown in "prediction.csv".House price prediction is one of the best examples of supervised learning. Then we will learn supervised learning types in the upcoming blog. until Connect with me and share it with your friends and colleagues!....💖.